
Imagine your outcomes report showing that more than 13,000 clinicians participated in an educational activity, with pre- to post-test aggregate scores jumping from 36% to 84%: a 48-percentage-point gain. On the surface, this looks phenomenal. But what if nearly 12,000 of those participants were students, retired clinicians and other clinicians who will never treat a patient with the condition the education was designed to address?
This is not a hypothetical, but a regular pattern in continuing education outcomes reporting with real consequences for how we understand, report and improve educational impact.
A case study, which we originally presented at the 2026 Alliance Annual Conference, examined a large outcomes dataset from a single online continuing education activity to demonstrate how outcomes results change when learner data is systematically segmented to reflect only those clinicians to whom the education was designed to impact.
Collecting the Data Is Only Half the Work
In the past two decades, the continuing education field has made meaningful strides in outcomes measurement. Pre-post survey designs, knowledge and competence assessments, and effect size reporting have become standards in outcomes reporting. Yet much of this infrastructure is undermined by a fundamental assumption that more participants are always better.
When attracting potential learners to education, the prevailing emphasis on high participant numbers often overshadows ensuring that the right learners are reached. This is commonly seen in target audience statements that end with broad language (i.e., “and other healthcare providers that may have a role in patient management”). This often produces data that overstates educational improvement. Including learners with limited prior exposure to a clinical area can artificially lower baseline scores, inflating apparent gains and making educational programs appear more impactful than they actually were for the clinicians who needed them most. This could also hold true for clinicians within a specialty who have a different clinical role than the target audience, such as oncology nurses within a program designed to address gaps for oncologists in differentiating and sequencing treatment modalities. While it may be important for nurses to understand new treatment approaches to improve their patient education and knowledge of these areas, it may not be appropriate to include this group in outcomes regarding treatment decision-making. What effect do these audience choices have on educational outcomes?
What the Data Shows
The case study re-analyzed a large outcomes dataset by progressively applying stricter inclusion criteria, creating four distinct cohorts. Knowledge and competence responses were recoded as evidence-based or not, and mean scores and Cohen’s d effect sizes were calculated before and after education.
Figure 1 shows outcomes by learner cohort. The learner data from one large online activity were split to determine multiple cohort groups:
- total sample
- intended target audience (subtracting industry representatives, retired clinicians, clinicians not seeing patients in the therapeutic area, other clinician specialties, students, technician, and other office staff)
- target audience practicing in the U.S. and
- U.S.-practicing target audience of only treaters (physicians/NPs/PAs).
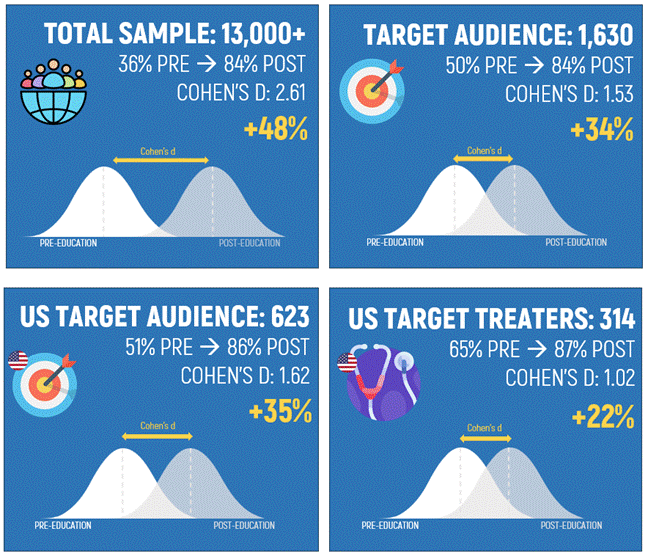
When observing the responses of the total sample, the pre-to-post scores increase from 36% to 84%, a 48-percentage point jump, and Cohen’s d effect size of 2.61. However, this number is greatly inflated by low baseline scores of nearly 12,000 students and other clinicians outside the relevant specialty.
Restricting the sample to U.S. treaters reduced the effect size from 2.61 to 1.02. While smaller, this effect is arguably more credible and more informative. It reflects true educational gain among people who had real baseline knowledge and could meaningfully apply what they learned in practice.
Notably, the post-education scores remain consistently high across all cohorts, around 84%-87% regardless of how narrowly the sample is defined. This suggests the educational content itself was sound and learners performed consistently. The primary driver of the effect size difference was sample composition and baseline differences.
Incentives in Outcomes Reporting
There is, at present, little incentive for educational providers to be rigorous about sample selection in outcomes reporting. An activity that reports a Cohen’s d of 2.61 across 13,000 learners will almost always look more compelling to supporters and other stakeholders than one reporting a Cohen’s d of 1.02 across 314 learners.
This creates a situation in which methodological rigor is quietly penalized by the metrics used to evaluate success. Providers who take the more discerning approach, by defining their audience narrowly, segmenting their data carefully and reporting outcomes that reflect genuine impact, may find their work overshadowed by providers who do not. If outcomes data is meant to drive improvement in clinical education and, ultimately, in patient care, then the standards for reporting that data need to reflect what the data actually represents.
Call to Action
Based on this analysis, three practices are recommended for outcomes reporting in continuing education:
- Implement inclusion criteria. Establish and consistently apply clear sample inclusion criteria that align with the educational objectives and intended target audience of the activity. Define “intended learner” before the activity launches, not after the data comes in, and hold analysis to that standard.
- Report stratified results. Present outcomes for the overall sample, but also break down results by key subgroups, including clinical role, specialty, geographic region, patients managed in that therapeutic area, etc. Showing both the broad and the targeted view provides a more complete and honest picture of educational effectiveness.
- Enhance transparency. Clearly disclose the composition of the learner sample and the sample of learners who are included in the outcomes analyses, such as who was included, who was excluded, and why. This fosters trust among stakeholders, enables meaningful comparisons across programs and positions the field to develop more consistent reporting norms over time.
The value of any outcomes measurement effort depends on whether the data is being analyzed in a way that reflects the education’s actual reach and purpose. The numbers may look smaller when you do this work carefully. The insights, however, will be far more valuable to educators, to partners, to stakeholders and most importantly, clinical decision-making and patient care.
Disclosures
This article stemmed initially from a session presented at the 2026 Alliance Annual Conference in Atlanta, Georgia, February 16-19, 2026. The authors work for organizations involved in the collection, measurement, and reporting of outcomes data. No other organization was involved in the conception or funding of this study.
AI Disclosure: This article was initially drafted with the assistance of Claude (Anthropic) based on content from a conference poster by the listed authors. The authors reviewed, edited, and take full responsibility for the final content.
Interested in this article? Join the discussion in the Alliance Community.
 Greg Salinas, PhD, is a medical education researcher and outcomes specialist with more than 17 years of experience in continuing medical education. He serves as the president of CE Outcomes, LLC, where his work includes the design, analysis and reporting of educational outcomes data. He is the author of multiple publications on clinician educational needs assessment and outcomes measurement spanning nearly two decades. Within the Alliance, Dr. Salinas currently serves on the AI Committee and has previously served on the DEI Committee and the Research Committee, including a term as Research Committee Chair.
Samantha Scalici, MBA, has 12+ years of experience specializing in the measurement and analysis of educational outcomes. She manages partnerships with educational providers to assess program impact, evaluate performance metrics and support data-driven decision-making in future educational initiatives.