“Stories are just data with a soul.” —Brene Brown
You don’t need to be a statistician to “talk stats,” nor is statistical jargon the most effective way to communicate the value and impact of your education. This article briefly explores analogs for statistical terms with explanations (including “translations” and examples), enabling educators of all proficiency levels to more confidently participate in meaningful data-driven conversations.
A significant barrier to “stats talk” is that many people inherently distrust statistics. In truth, statistics don’t lie; the lie is in the (mis)interpretation of statistics. Yet, because statistics are used to assess and benchmark outcomes, there exists a misalignment in our industry.
How do we align these seemingly divergent approaches and attitudes to outcomes reporting?
The best way is to move beyond counting things and tell a story.
Aside from a beginning, middle and an end, effective storytelling requires language with a shared, accessible meaning. So, if an outcomes report uses statistics to represent findings, the associated language is valuable only when a shared understanding is created.
How do we tell meaningful outcomes stories with statistics that resonate with all stakeholders?
We need to marry our intuitive understanding of statistical terms with their actual meaning, developing an accurate, accessible, shared language. It’s not an easy task, but also not an impossible one when broken down into components.
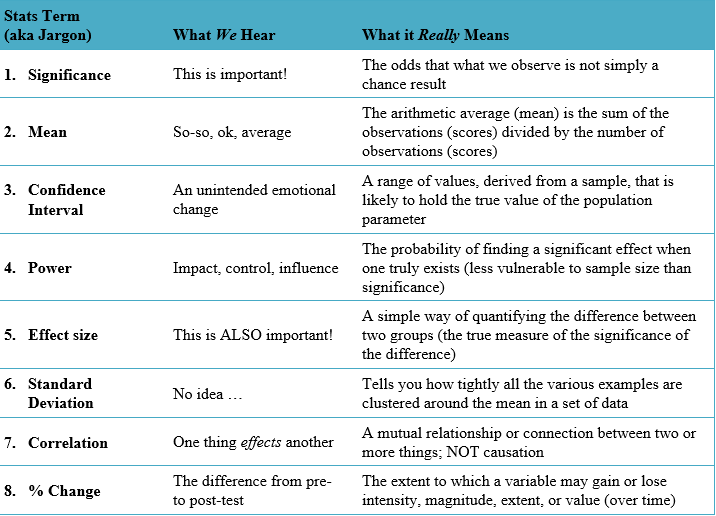
Urban Dictionary of Statistical Terminology for CE

Let’s translate the chart above into useable language, term-by-term:
1. Significance:
The single most mentioned statistic in outcomes reporting. Though statistical significance represents the stamp of approval on change, it means very little alone. Significance represents the odds that an observed increase from pre-test is (not) due to chance; it does not mean that the specific increase is replicable.
Also, a p-value of <.0005 is not “better” than ≤ .05; simply, the latter accepts slightly greater chance into rejecting the null hypothesis. In research, we never prove our hypothesis; we can only reject the null (i.e., that there was no change from pre-test).
2. Mean:
The average is commonly reported without question; however, mean averages are vulnerable to influence by extreme scores, so we should employ additional statistics to confirm our assumptions.
3. Confidence Interval:
A range wherein lies the “true score.” Ironically, we can never actually know the true score. In statistics, we acknowledge and accept error, while at the same time attempting to minimize it.
4. Power:
The likelihood of finding an effect when one exists (or, correctly rejecting the null hypothesis). As with many statistics, power is meaningless when examined in isolation; the meaning is created in combination. The power of a study is often examined in conjunction with sample size and effect size.
5. Effect Size:
The magnitude of impact on your sample, or between a control and a test group. When combined with significance and power, effect size is a meaningful way to demonstrate the impact of your education.
6. Standard Deviation:
The “mean of the mean.” Standard deviations (SD) allow us to dig a little deeper into our data. SDs, when paired with mean scores, represent individual learner score variation around the mean. A larger SD signals the presence of extreme scores (in either direction), lessening the validity of our mean and suggesting the presence areas (or items) that represent a challenge to learners (i.e., learning gaps).
7. Correlation:
Correlation is not causation, rather correlation is a relationship between two variables that can be evaluated in terms of strength and significance. Additionally, when interpreting correlation, the direction of the relationship (positive or negative) is not altogether intuitive: a positive correlation indicates the extent to which those variables increase or decrease in parallel; a negative correlation indicates the extent to which one variable increases as the other decreases.
It is often informative to correlate objective metrics (e.g., knowledge items) with subjective metrics (e.g., confidence items). For instance, if a learner group is showing low knowledge scores in one area and yet providing high confidence ratings in the same area (i.e., a negative correlation), those results taken together provide insight that can help direct the instructional design of future education.
8. Percent Change:
Percent change is not the absolute difference (between pre- and post-test averages). Percent change quantifies how much the pre-test average differs from post-test, relative to pre-test using the formula: [(pre - post)/pre] x 100. This method is typically more useful when constructing a meaningful narrative, as it provides context.
There are many unknowns in stats, and a cohesive stats story often requires utilizing a combination of multiple approaches.
Exercise: Interpret the graphic below. What narrative would you construct?

Think about the data before moving on.
In this example: These learners (sample size N = 371) demonstrated an average increase of 24 percent from a relatively low (based on meta-data findings) baseline average of 61 percent to a final average score of 76 percent. Because the 24 percent improvement is statistically significant (p < 0.0005), we can be confident that our result is not simply due to chance.
And, while the spread of individual scores (the standard deviations or SDs) isn’t grouped tightly to the mean by post-test (varying by 25 points in either direction), the spread of scores is well within our established benchmarks. So, we know that most learners are performing better by post-test.
These findings, paired with a high level of power (1.0) and medium effect size (d = 0.57), provide strong, valid and reliable evidence that the education was effective in improving this sample’s proficiency.
This example was meant to show how stats talk can be accessible to a wide audience without sacrificing statistical rigor. It only takes a willingness to move past the numbers (and p-values) to communicate shared practical meaning.
“Statistical significance is the least interesting thing about the results. You should describe the results in terms of measures of magnitude — not just, does a treatment affect people, but how much does it affect them.” —Gene V. Glass